Well, this "thinking out loud" thing is something I'm not really used to (I'm trying to learn), so please bear with me. I'm not even sure if I'll be able to say what I'm thinking, for that matter... That said...
Last year I offered my first open course ever, called e-Learning (ELRN). It was supposed to be an exploration of the present and future (at a local level) of technology in education. And I decided I wanted it to be open, and also that I wouldn't use a LMS. I wanted to do something similar to the things Stephen and George did with CCK08, but I didn't have the infrastructure to make that happen.
Following David, Alec, George and Stephen, I chose a wiki as the platform to publish the weekly activities of the course, and blogs as the main reflective tool for students. The decision didn't have to do with the technology, but with the reflexive processes that it allows, based on my own experience. Blogs would be the publishing platform of choice. The discussion wouldn't happen in centralized discussion fora, but in each participant's blog. It would be decentralized.
Also, given the characteristics of my own context (Colombia), where there are not that many education blogs online, and most of us are not power users, I wanted to make access to the info produced in the course as easy as possible. Participants would be able to get info by e-mail, and those who felt comfortable with it, by RSS. To participate in the course would not require to login in a specific platform to access content, and it should be a real possibility to send and get information by e-mail.
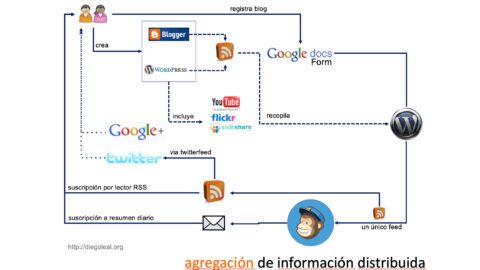
So all these intentions led me to find ways to collect all the info generated in the blogs, and distribute it by e-mail. That led me to work a bit with Pipes, something I hadn't done before. The first product of that work looked like this, and I talked about it in another post:

At the end of that post, I noticed some limitations that I was still trying to figure out:
- How do I analyze all the data coming out of the course? If I wanted to see the progress/evolution of different participants, what kind of tools should I use? Is it possible to do it with the pipe I have now?
- Feedburner is not flexible enough with the mail subscriptions. I'd like every participant to decide whether she gets a daily or real time notification.
As I went through ELRN, something else proved difficult: How could I (as a facilitator) keep tabs on the comments of formal students? Monitoring every comment in every post was, clearly, a daunting task...
At the end of the course I tried to generate, by hand, some sort of analysis of what happened, including posts frequency and the blog comment network generated along the course, which was possible thanks to the small number of participants. That network looked like this:

So I realized that such a graph could be very useful to monitor the participation in the course, and to detect (and maybe do something about) people who were not being part of the conversation. It could be used as a "lurker detector", so to speak. Nevertheless, I told myself, in order to be useful you would have to get this kind of info not at the end of the course, but along the road. And, doing that by hand would be very time consuming. And that leads me, finally, to this post.
So, What if you could generate such a graph (described as a GraphML file) from a RSS feed? How could you do that?
Last year I started another open course about groups, networks and communities (called GRYC in Spanish), which for several reasons was postponed for this year. That gave me some time to think about the problem (but not to solve it). Here's where I am right now:

(Side note: I used some of Tony Hirst ideas to generate a map from the GDocs form I'm using as registration for the course. Here's the pipe and here's the map. Very cool indeed!)
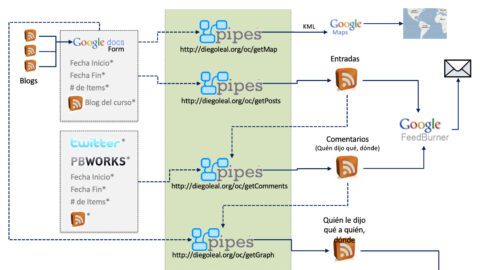
If we go back to the first diagram, we see that I have a pipe compiling feeds from different blogs. So I wondered how could I get comments from those blogs, given that there were many people using an already existing blog for the course and tagging their posts, and there were many different platforms being used at the same time, each one with its own approach to comments (WP doesn't have specific feeds for comments in a category, while Blogger does. Some people use Feedburner for their feeds, which makes impossible to discover a comment feed, and so on).
What I did was to create a new pipe (the second one in the sequence), which takes the first one as input and extracts the comment feed associated to each post, and then gets the items included in each one of those feeds. Also, I'm getting (using YQL) Twitter messages and comments made in the wiki. Everything is put together and at the end I have a feed including who said what, and where that was said (blogs, twitter, wiki). It's quite easy to extend this and include other sources (Google Groups, Moodle fora, or anything that can imported into Pipes). Now, maybe there's a more simple way to do this but, well, I'm still learning to use Pipes (for example, can all this be parameterized?).. ![]()
There is a "dark side" to this. I still have to do a lot of "maintenance" in the original data, and I have to consider specific cases that made the pipes not as simple as I'd like them to be. Let's say, someone is using Disqus for the comments, and someone else uses different display names for the posts and the comments in different platforms. Some comment feeds are not being discovered by Pipes... It's not nice. It's not 'clean'...
My basic graph, as shown above, includes people as nodes and comments as edges. So I still need to know who said what to whom. I could do this in the second pipe, but I don't want to add any more complexity (that is, processing time) to that pipe. So, in a third pipe I get results from the second pipe, I process each item, and at the end I have what I need: I'm putting in each item's title the source and target of the comment (that is, their names) and the date. Each item still contains the link to the comment, also.
But, where do I go from here? Some ideas and issues related to the first (blue) bubble:
- I could write some PHP code to get the RSS feed and process each item, generating a GraphML text file on the fly. Of course, it could be Java as well. After all, a framework such as Jung includes a lot of utilities now, even to generate the visual representation of a graph... But I'm not sure if it processes RSS...
- Um, but what happens when I do the same process the next day? Would it make sense, then, to put all the RSS info inside a DB, so I can have even more flexibility later?
- Maybe having things in a DB will let me include more info in the graph. Let's say, what if the size of the nodes is tied to the amount of posts generated? That could be useful too...
- In the end, having a DB will allow me to split tasks. One thing is to add info from the feed (a daily process, let's say), another one is to generate a GraphML file from that info. This could be done on demand, and cached for later use.
But what about the second (green) bubble? The idea here is to go from the text file to a useful visualization. We could even thing about creating (automatically) animations showing the daily progress of a course, discovering when new nodes (this is, new people posting) appear, and showing new edges as they emerge.
- The weapon of choice would be Jung, clearly (I still don't know if something as Cyclone has anything to do with this problem). With that we can get from GraphML to images, I think. Now, if we want to create PNG animations, well, I still have no idea how to do it.
- In any case, I'd have to go back to Java (long time no see!) and learn a lot about a lot of things. And time seems to be a quite scarce resource...
So, where does that leave us? You get to extract info from the pipes in "real-time" and generate GraphML files from it (or whatever you want) to show the status of the graph at any given time. This could help to see who's being left behind in the community (because they're not writing nor commenting, for example) in an easy way, which would help in massive courses. Actually, you could even send specific e-mail messages based on the configuration of the graph (nice!).
And, where do we go from here? Well, what if you applied the logic of an Open Course to a whole academic program? What if participating in a course means just tagging your blog posts with a code for that course? What if we aggregate everything in something such as Elgg, and keep using pipes to distribute content around (as we see fit)? Would that look like a more decentralized approach to a LMS? With new monitoring tools, more focused on the interactions? With students having more control of their info?
I just don't know. What I do know is that this approach, as much as I like it, is not scalable. And if we want to get more serious about being open we will need, eventually, to provide alternative solutions easy to use for administrators, teachers and students, and analytical tools focused on the kind of things we'd like to observe and foster in our students.
Anyway, keep in mind that I'm thinking out loud here. This is the second time I'm trying this architecture, so there are a lot of things to improve and many others that make no sense at all. I'm just trying to figure out if it makes sense to work more on this. So thanks in advance for your thoughts! ![]()
 A excepción de que se indique lo contrario, este contenido está publicado bajo una licencia Creative Commons.